The Evolution of the Customer Journey Map

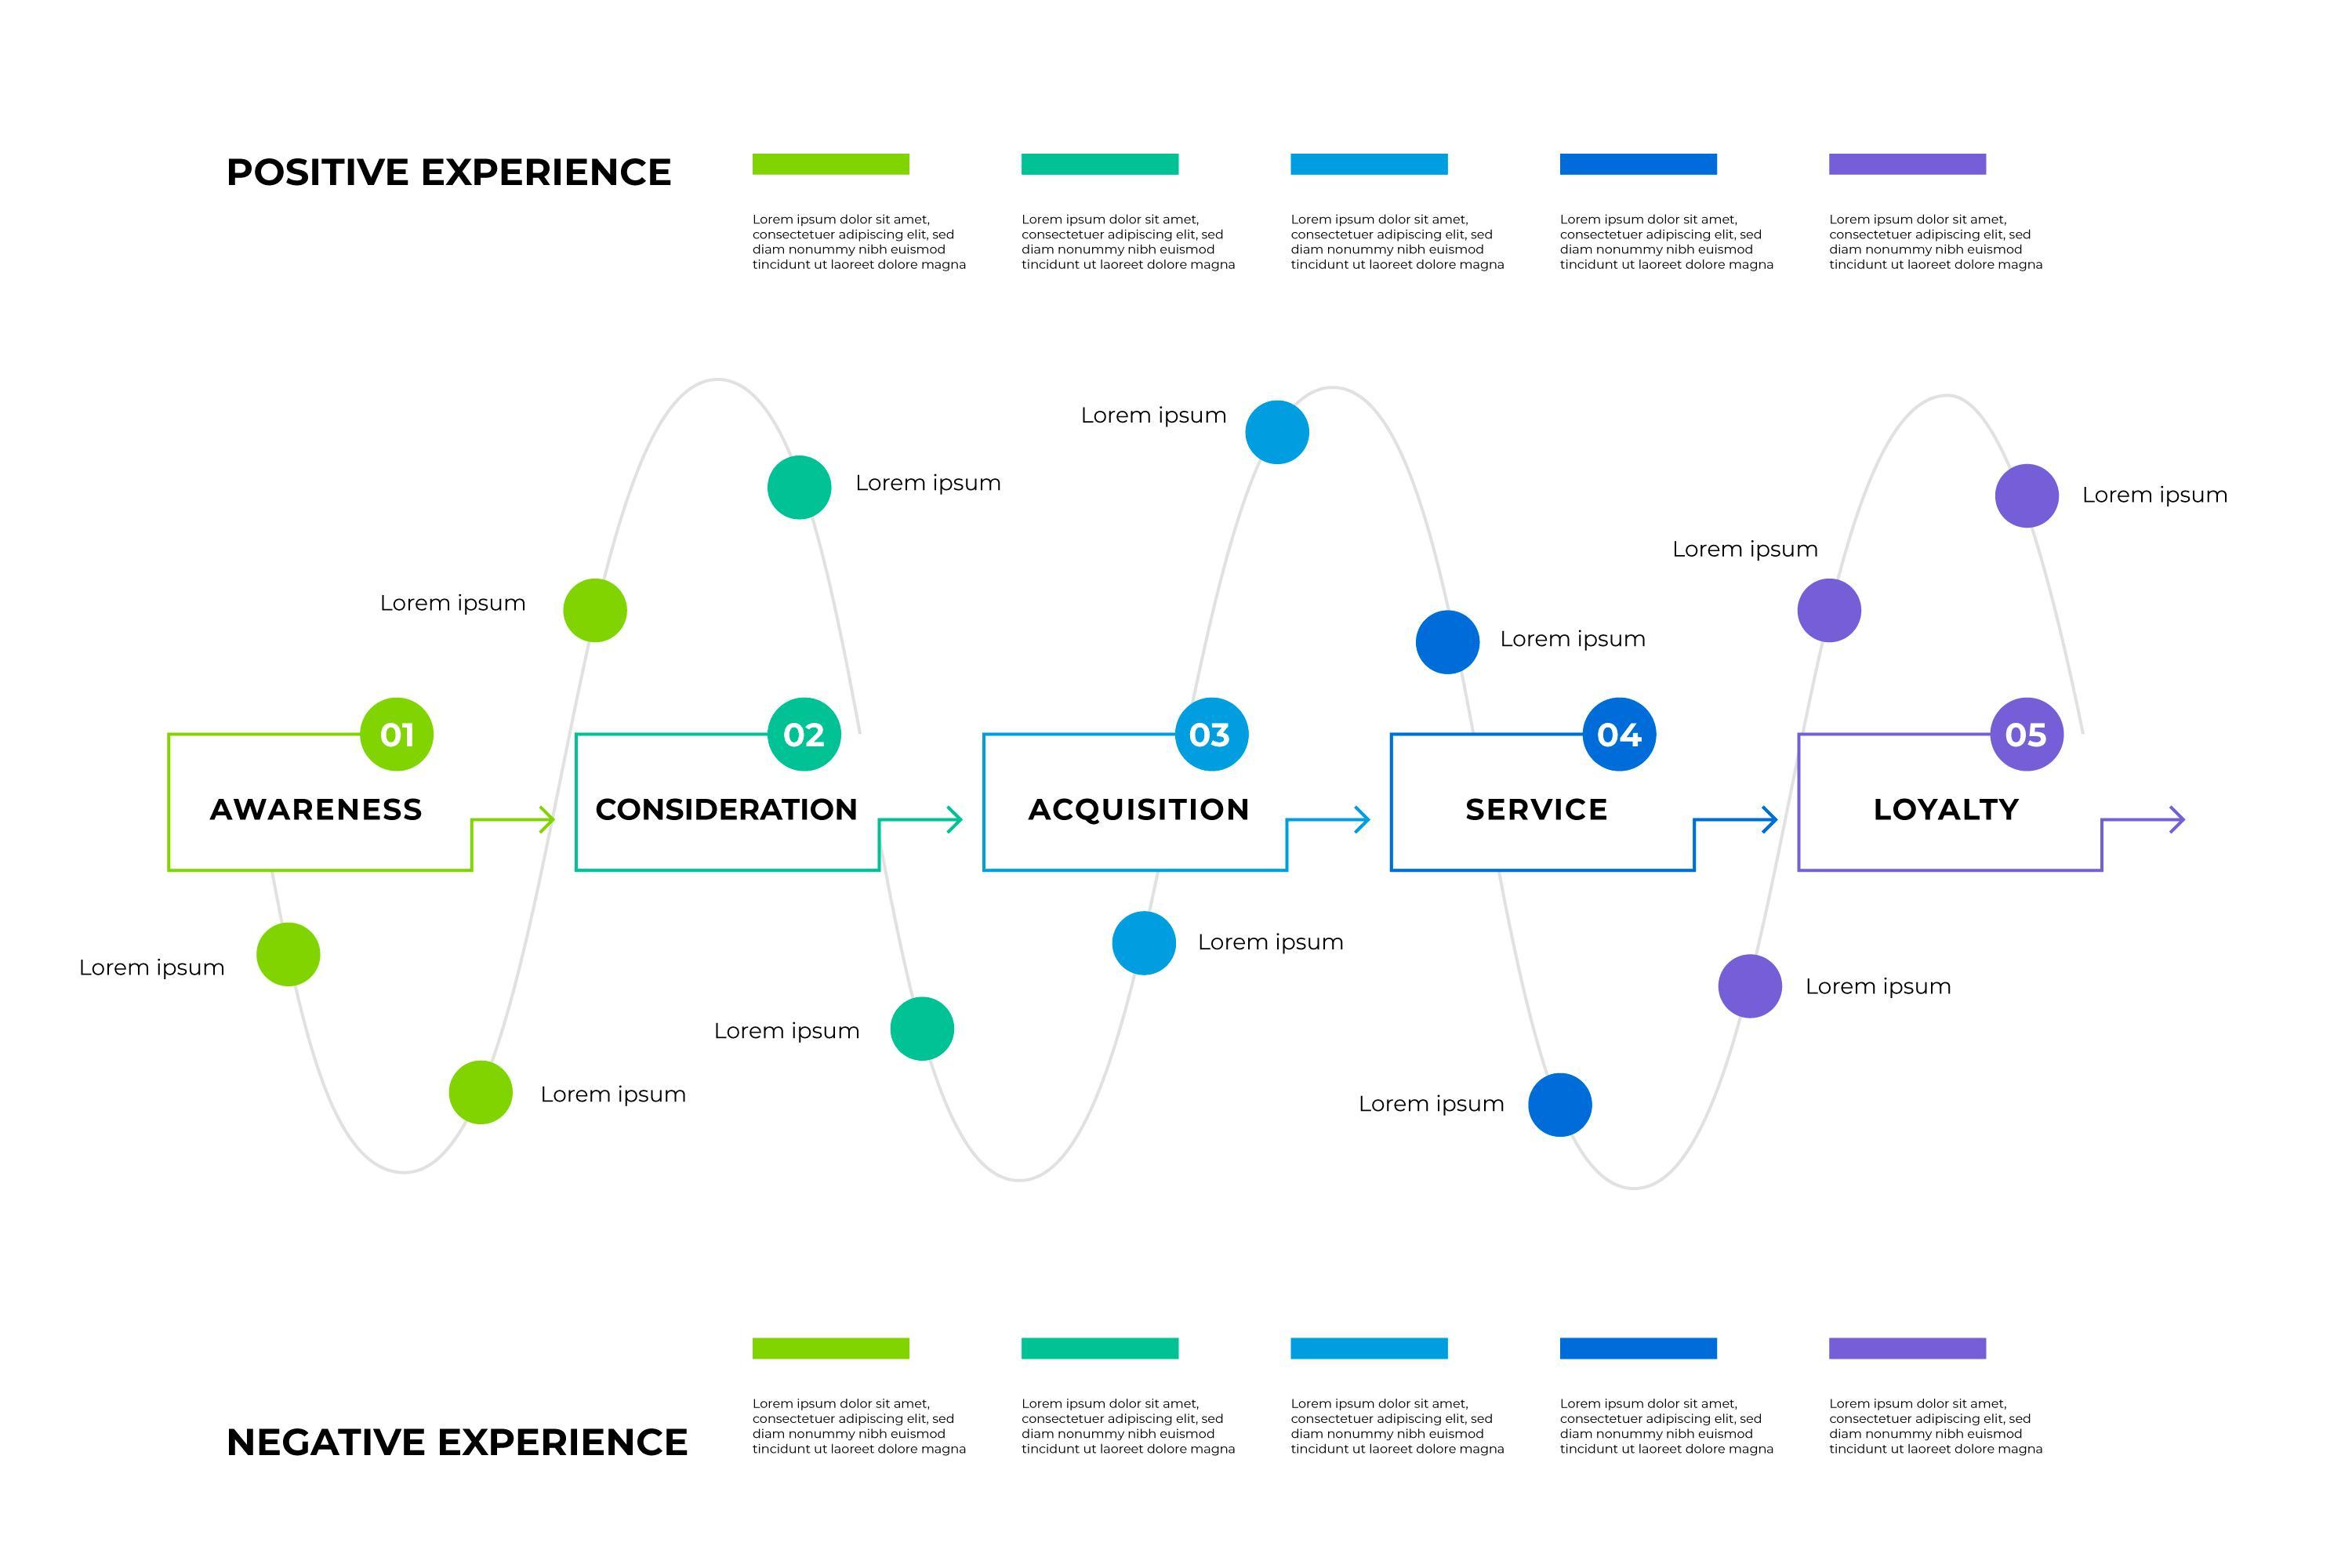
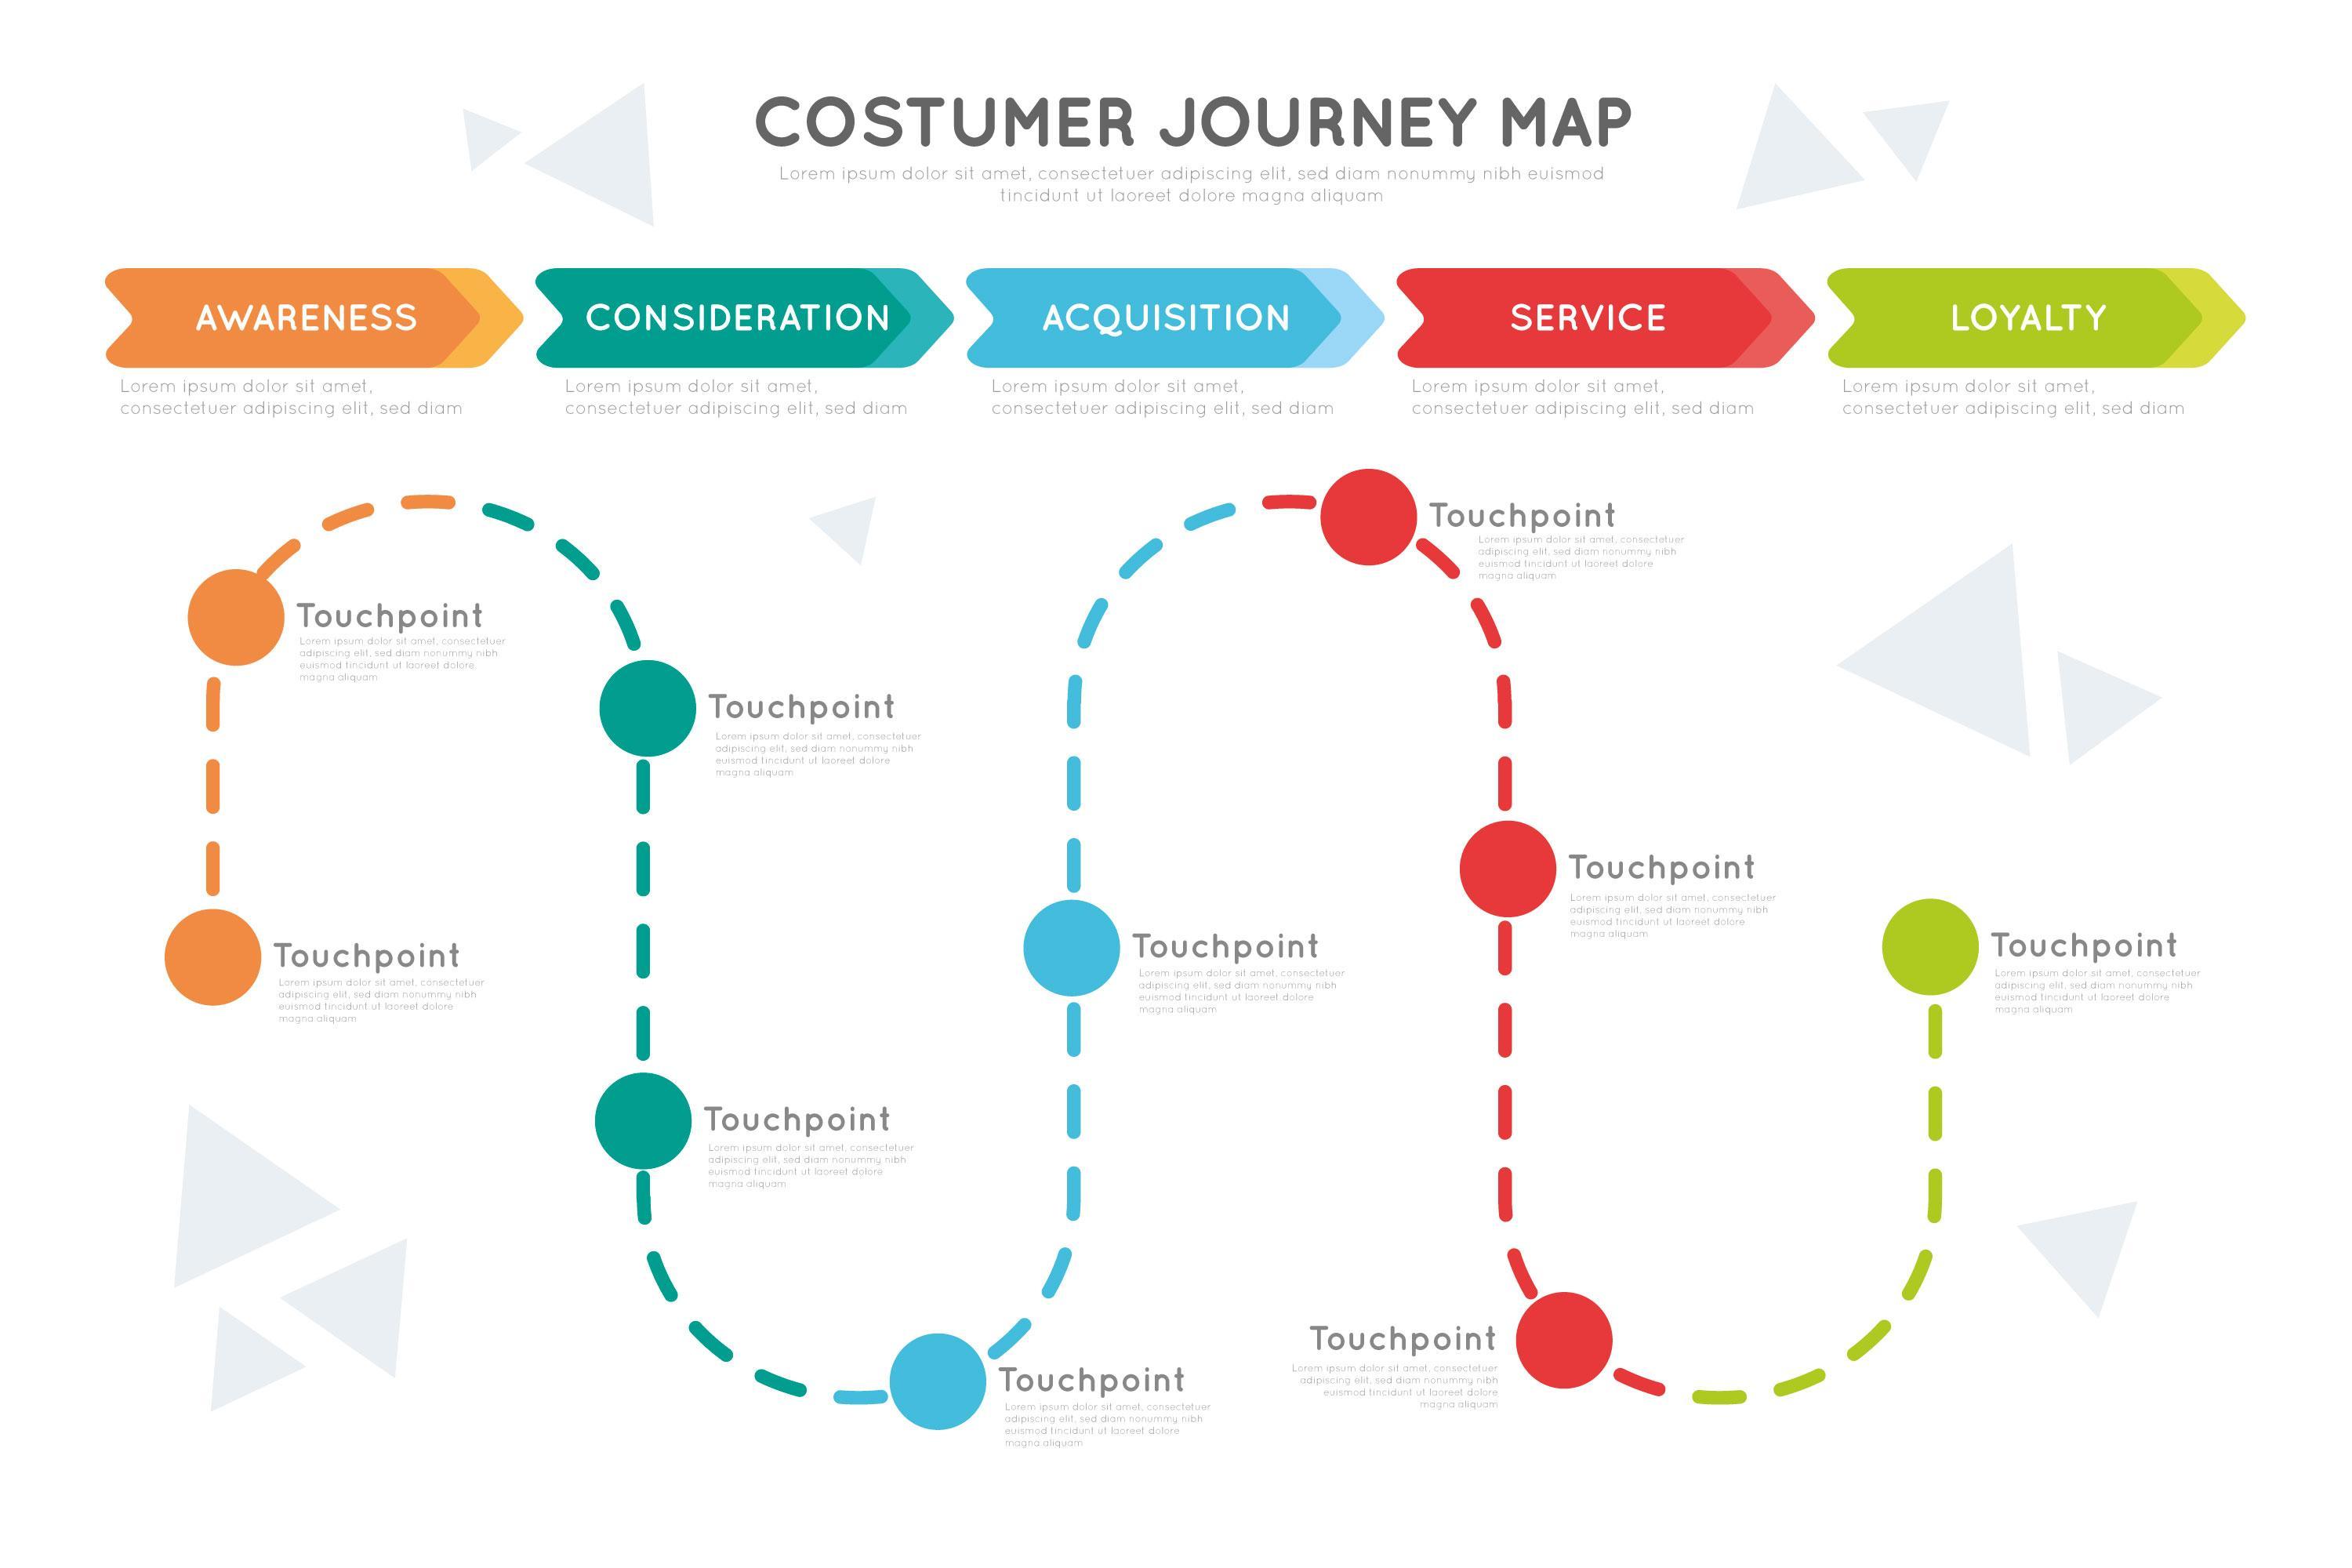
When I first discovered the concept of customer journey mapping, it looked like something from a textbook, structured, linear, and almost too perfect to be real. Back then, it was presented as a clean funnel: Awareness, Consideration, Purchase, Loyalty, Advocacy. For a while, I believed it. But when I started working directly with customers, observing how they actually made decisions, how they switched devices, how emotions shifted between excitement and frustration, I realized something powerful: the real customer journey is not a funnel; it is a living, breathing ecosystem. The evolution of customer journey mapping mirrors the evolution of customer behavior itself, from simple transactions to complex emotional relationships.
The Early Days: The Linear Funnel Era
Let us go back to how it all started. When traditional marketers talked about the customer journey, they really meant the sales funnel. The idea was simple: attract attention, generate interest, drive desire, and close the deal. I remember my first campaign using this model. We tracked everything by conversion rates, how many people clicked, signed up, or purchased.
But something always felt incomplete. People did not move neatly from awareness to purchase. Some jumped straight to comparing brands before even understanding their problem. Others bought impulsively but disappeared right after. The linear model could not explain that unpredictability. It lacked emotion. It lacked humanity. That was when I realized the customer journey was not a path; it was a story.
If you are just starting to build your own map, it might help to explore Understanding the Importance of Customer Journey Maps first, it will help you see why this shift matters.
Stage Two: The Multichannel Expansion
Then came the digital explosion: websites, social media, mobile apps, email marketing, and later, influencer culture. Customers no longer relied on one or two sources of information. They researched brands across multiple channels, often simultaneously.
I remember one project where the customer discovered the product on Instagram, visited the website two days later, checked YouTube reviews, subscribed to the newsletter, and finally purchased from a retargeting ad. Five touchpoints, four devices, three different mindsets, one decision. That experience changed my view completely. I stopped mapping paths and started mapping moments. It became less about where they went next and more about what they felt right now.
This approach aligns with what I cover in Components of a Customer Journey Map, where every emotional touchpoint gets a role.
Stage Three: Emotion Takes Center Stage
The more I studied customer behavior, the more I realized something I now consider the foundation of modern marketing: data explains actions, but emotions explain decisions. A customer might say they choose a product for features, but deep down, it is how that product makes them feel that seals the deal.
For example:
- When someone buys an eco-friendly product, it is not just about sustainability, it is about feeling responsible.
- When they join a brand community, it is not about access, it is about belonging.
- When they stay loyal, it is not about habit, it is about trust.
So I began building empathy into my journey maps. Instead of writing “Customer sees ad, clicks link, visits page,” I started writing: “Customer feels inspired, curious, hesitant, reassured, confident.” That emotional translation completely transformed how I created campaigns. It was not just about optimization, it was about connection.
If you want to learn how to map emotional shifts in your strategy, visit Steps to Creating a Customer Journey Map, where I detail emotional stage mapping techniques.
Stage Four: The Rise of Data-Driven Mapping
As digital tools advanced, customer journey mapping evolved again, this time through data and analytics. Platforms like Google Analytics, Mixpanel, HubSpot, and Hotjar started providing real-time visibility into how users interacted with brands. For the first time, I could actually see where people dropped off, where they hesitated, what content they revisited, and how long they stayed. It felt like someone had turned on the lights.
But there was a catch. The more I looked at numbers, the easier it became to forget the humans behind them. So I made a personal rule: let data guide decisions, but let empathy guide strategy. I would often sit with customer support teams, listen to complaints, read reviews, and even call users directly to understand why they acted the way they did. That blend of data and emotion helped me create what I now call living journey maps, ones that evolve as real feedback comes in.
You can see how this hybrid approach fits into the structure in Components of a Customer Journey Map.
A Practical Example of Combining Data and Empathy
One pattern I’ve seen repeatedly: heatmap and session-recording data will show a cluster of users hovering over a shipping cost line right before abandoning a cart. The number alone tells you where they stopped. It doesn’t tell you why. Pairing that data point with a handful of direct customer interviews, or even a short on-page survey triggered at the moment of hesitation, usually surfaces the actual emotional beat: surprise, followed by a sense of being misled, followed by exit. Once you know that, the fix isn’t just “reduce shipping cost,” it’s “show shipping cost earlier so the surprise never happens.” Data tells you where to look. Talking to actual people tells you what you’re looking at.
Stage Five: The Personalization Revolution
Then came the personalization era, a game changer. When I first implemented personalized journeys using automation tools, customer engagement skyrocketed. People responded better when the content, tone, and timing felt tailored to them. It was not manipulation; it was respect, acknowledging that every customer story is unique.
I began segmenting journeys based on:
- Demographics, age, location, profession
- Behavioral patterns, purchase history, time on site
- Emotional cues, feedback tone, previous interactions
And I did not just personalize communication, I personalized timing. If a user abandoned a cart, I would wait 12 hours before sending a reminder, not five minutes. Personalization is not about shouting louder, it is about speaking at the right moment in the right voice.
Stage Six: Omnichannel Experience Becomes Essential
As marketing matured, so did customer expectations. People did not just want multiple channels, they wanted consistency across them. I remember testing this myself. I followed a brand from Instagram to their website to their customer chat. Everywhere, the tone changed, playful on social, formal on site, robotic in chat. It was jarring. It broke trust.
That was when I understood that omnichannel consistency is not optional anymore, it is the baseline for brand credibility. Now, when I build journey maps, I ensure one emotional voice flows across all platforms. Whether the customer is reading a blog, chatting with support, or opening an email, it should feel like one continuous conversation.
You can explore more about how omnichannel consistency drives long-term value in Benefits of Customer Journey Mapping.

Stage Seven: Real-Time, Predictive, and AI-Powered Journeys
We are now in what I like to call the intelligent journey era, powered by AI and predictive analytics. Today, brands can anticipate what a user might want before they even express it. Streaming platforms recommend content based on mood patterns. E-commerce apps show offers before you search. Chatbots resolve issues before you contact support.
The future is not about guiding the journey anymore, it is about co-creating it in real time. But even in this AI-driven age, one thing remains constant: the human heartbeat. Automation enhances experience, but empathy defines it. So I use AI to scale empathy, not replace it.
Where AI Actually Helps, and Where It Doesn’t
It’s worth being specific here, because “AI-powered journey mapping” gets thrown around loosely. What predictive models are genuinely good at: spotting patterns across thousands of sessions that no human could hold in their head at once, flagging which segment of users is statistically likely to churn in the next thirty days, and surfacing the next-best-action for a given customer based on what similar customers did. What they’re still bad at: understanding why a specific customer feels a specific way, or catching the kind of qualitative signal that only shows up when someone actually reads twenty support transcripts in a row and notices a recurring frustration nobody coded a tag for. The teams getting the most value from AI in journey mapping right now are the ones using it to handle the first category at scale, freeing up actual humans to spend their limited time on the second.
Stage Eight: The Modern Journey, A Continuous Loop
The biggest realization I have had over the years is this: the customer journey does not end. It loops, through advocacy, retention, reactivation, and renewal. A happy customer does not just buy again; they bring others in. That is how ecosystems form. So now, my maps are circular. They start with awareness and evolve into advocacy, where one person’s end becomes another person’s beginning.
That is the beauty of modern marketing, when you stop thinking in funnels and start thinking in circles, everything changes.
Mistakes I Made Along the Way
It would be dishonest to write this as if the evolution was smooth. A few of the mistakes taught me more than any framework did.
Mapping the Journey I Wanted Customers to Take, Not the One They Actually Took
Early on, I built maps that looked suspiciously like the ideal funnel I wanted to sell to my own boss: clean, five stages, no mess. When I finally sat down with real session data, the actual paths looked nothing like it. People looped back to the homepage after almost checking out. They compared prices on a competitor’s site mid-session and came back. A map built from wishful thinking is worse than no map at all, because it gives you false confidence in a story that isn’t true.
Treating the Map as a One-Time Deliverable
I once spent three weeks building an exhaustive, beautifully designed journey map for a client, presented it, got applause, and then watched it sit in a shared drive for a year, never updated, never referenced again. A journey map that isn’t tied to an owner and a review cadence is a poster, not a tool. Now I never hand off a map without also handing off a plan for who revisits it, and when.
Confusing “More Touchpoints” With “Better Map”
There was a phase where I thought a more detailed map was automatically a better one, tracking every micro-interaction until the map became a wall of sticky notes nobody could act on. The most useful maps I build now are the ones that fit on a single page and still capture the emotional arc. Detail is only valuable if someone on the team can actually hold the whole picture in their head and make a decision from it.
Measuring Whether a Journey Map Actually Changed Anything
A journey map is a diagnostic tool, not the fix itself. The real test of whether the work was worth doing is whether it led to a change that moved a number. A few ways I’ve validated that over the years:
After identifying an emotional low point in the journey, say, the moment shipping costs appear unexpectedly, I’ll implement a specific fix (showing estimated shipping earlier in the product page) and then track cart abandonment rate for that segment over the following month against the prior baseline. If the map correctly identified the friction point, the metric moves. If it doesn’t move, that’s useful information too, it means either the fix didn’t address the real issue, or the emotional read in the map was wrong, and it’s worth going back to the actual customer conversations rather than assuming the first fix attempt failed for no reason.
Net Promoter Score and customer effort score, tracked at the specific touchpoints your map flags as high-friction rather than as one blunt company-wide number, tend to be the most honest long-term signal that the map is doing its job. A map that never gets checked against a real metric is just a nicely designed guess.
Tools That Actually Support This Kind of Mapping
For the data layer, Google Analytics 4 and Mixpanel remain the backbone for most teams I’ve worked with, GA4’s path exploration reports are genuinely useful for seeing real, messy, non-linear paths rather than the clean funnel you’d expect. Hotjar and Microsoft Clarity add the qualitative layer, session recordings and heatmaps that show you where hesitation actually happens, not just where people converted. For the emotional and voice-of-customer layer, a tool as simple as a well-timed on-page survey (Hotjar and Qualaroo both do this) combined with a habit of actually reading support tickets rather than only looking at ticket-volume dashboards, does more for map accuracy than any single expensive platform. None of these tools build the map for you. They just make sure the map you build is grounded in what actually happened, not what you assumed happened.
How to Actually Start Mapping This Way
If everything above sounds abstract, here’s the concrete version of how I’d tell someone to start today, without needing an enterprise analytics stack.
Start with a single, specific customer segment, not “all customers,” but one real type of buyer with a name and a story you can hold in your head. Walk their actual path using whatever data you already have: page analytics, support tickets, email open rates, even just your own sales team’s memory of common objections. At each touchpoint, write down two things side by side: what they did, and what they likely felt doing it. Don’t guess at the feeling in isolation, cross-reference it against real quotes from reviews, support chats, or survey responses wherever you can find them.
Once you have that first pass, the map isn’t finished, it’s a draft you test. Watch a few real session recordings against it. Interview two or three actual customers from that segment and see where their story diverges from what you wrote. Update the map. This is the difference between a journey map that sits in a slide deck untouched for a year and one that actually changes how your team makes decisions, it has to stay a living document, revisited on a real cadence, not a one-time workshop output.
A cadence that’s worked well for teams I’ve worked with: a light monthly check-in where whoever owns the map skims recent support tickets and analytics for anything that contradicts it, and a deeper quarterly review where the map gets actually redrawn if the business or the customer base has shifted meaningfully. Anything less frequent and the map quietly drifts out of sync with reality; anything more frequent tends to burn out whoever’s responsible for maintaining it without adding proportional value.
My Reflection
When I look back at how customer journey mapping has evolved, I see more than marketing progress, I see a mirror of human behavior. We have gone from transactions to relationships, from selling to serving, from funnels to flows.
Every stage of this evolution taught me one truth: the customer journey map is never finished because people are never static. That is what makes it so exciting to work in this space. Each day, new tools, emotions, and patterns appear, and with them, new opportunities to connect more deeply.
Up next, I will break down the core building blocks that make these journeys come alive in Customer Journey Mapping: Understanding Every Step of Your Customer’s Experience. That is where we will move from philosophy to practice, step by step.
Interesting Read
10 Best Software for Dropshipping Success